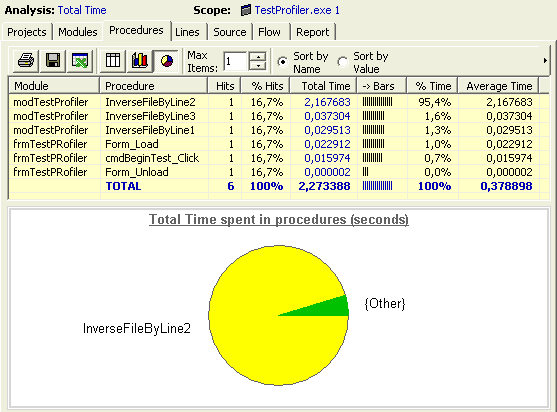

The data pane (above) displays accurate profile data for the current view scope and the current display mode (time, child time or coverage). You may sort data by column by clicking the header of the column. You may export the grid data by clicking the Export grid contents button.
The graph pane (below) displays a representation of this data
either as a pie chart or bar chart.
Note: the column of data represented is displayed in the title
of the graph, but is not selectable. It may not be the same for both
types of graph.
Toolbar

Print: prints the first page (only) of the data currently displayed in the grid, as well as the graph if it is displayed
Save: saves the data that is currently displayed in the grid to a text file, tab or comma delimited, which can be imported in other applications such as MS Excel.
View in Excel: exports the data that is currently displayed in the grid view to a .csv text file, comma delimited, and open it in the default .csv file reader such as MS Excel if installed.
Grid only: hides the graph pane
Bar Graph - Pie Graph: shows the graph pane, and displays the selected type of graph
Max items: sets the maximum number of data item torepresent in graphs. Other items are aggregated and displayed as {Other} (see example above).
Sort by Name / Value: determines in which order items are successively displayed.
Hyperlinks
Modules, procedures and lines displayed in grid are hyperlinked:
- left click on an item to select it and see it in the next tab
- double click on an item to see it in the source view
- right click on an item to pop up a context menu that allows to view the item in another tab, or even load the original source and pinpoint the item in the original source code !

Data Reference
The time is given in seconds.
Average time = total time / number of execution
Child time = time spent in children functions, that is, functions that are called by the corresponding line or procedure
Line coverage = number of lines hit at least once / total number of profiled lines
Procedure coverage = number of procedures called at least once / total number of profiled procedures
Note: procedures and lines that are excluded from the profiling (with tags) are not taken into account.
Total: it is usually the total of the column, except in the case of average time where it is the average value of the column.
# means "Number of..."
% means "Percentage of..."
Left lines or procedures are the number of lines or procedures that were never executed.
Line ID is an internal ID value for each line, corresponding to the order they appear in the code.
-> Bars displays the column of data to its left as an inline logarithmic bar graph.
Critical Coverage = coverage data for the part of the source code defined as critical via tags.
Reference
Average/Total time - Project(s)

This view is useful with .vbg groups analysis.
Average/Total time - Modules

Average/Total time - Procedures

Average/Total time - Lines

Tip: sort this view by Line ID if you wish to display them in the order they appear in the code.
Children time - Procedures

Children time - Lines

Coverage - Project(s)

This view is useful with .vbg groups analysis.
Coverage - Modules

Coverage - Procedures

Coverage - Lines
